- Markets
- Resources
- Company

")
Welcome to the New Era of AI-Driven Trading!
CAPEX and Devexa are shaping a new era of trading powered by artificial intelligence, where decisions are clearer, insights faster, and opportunities easier to act on.

Learn the Markets with a Trusted Expert
Access daily insights and educational content from Andreas Thalassinos, one of the industry’s most experienced market experts.
Your First Trades Are on Us, Risk-Free!!
Explore 5,000+ opportunities across commodities, forex, and stocks, with protection on your first trades.
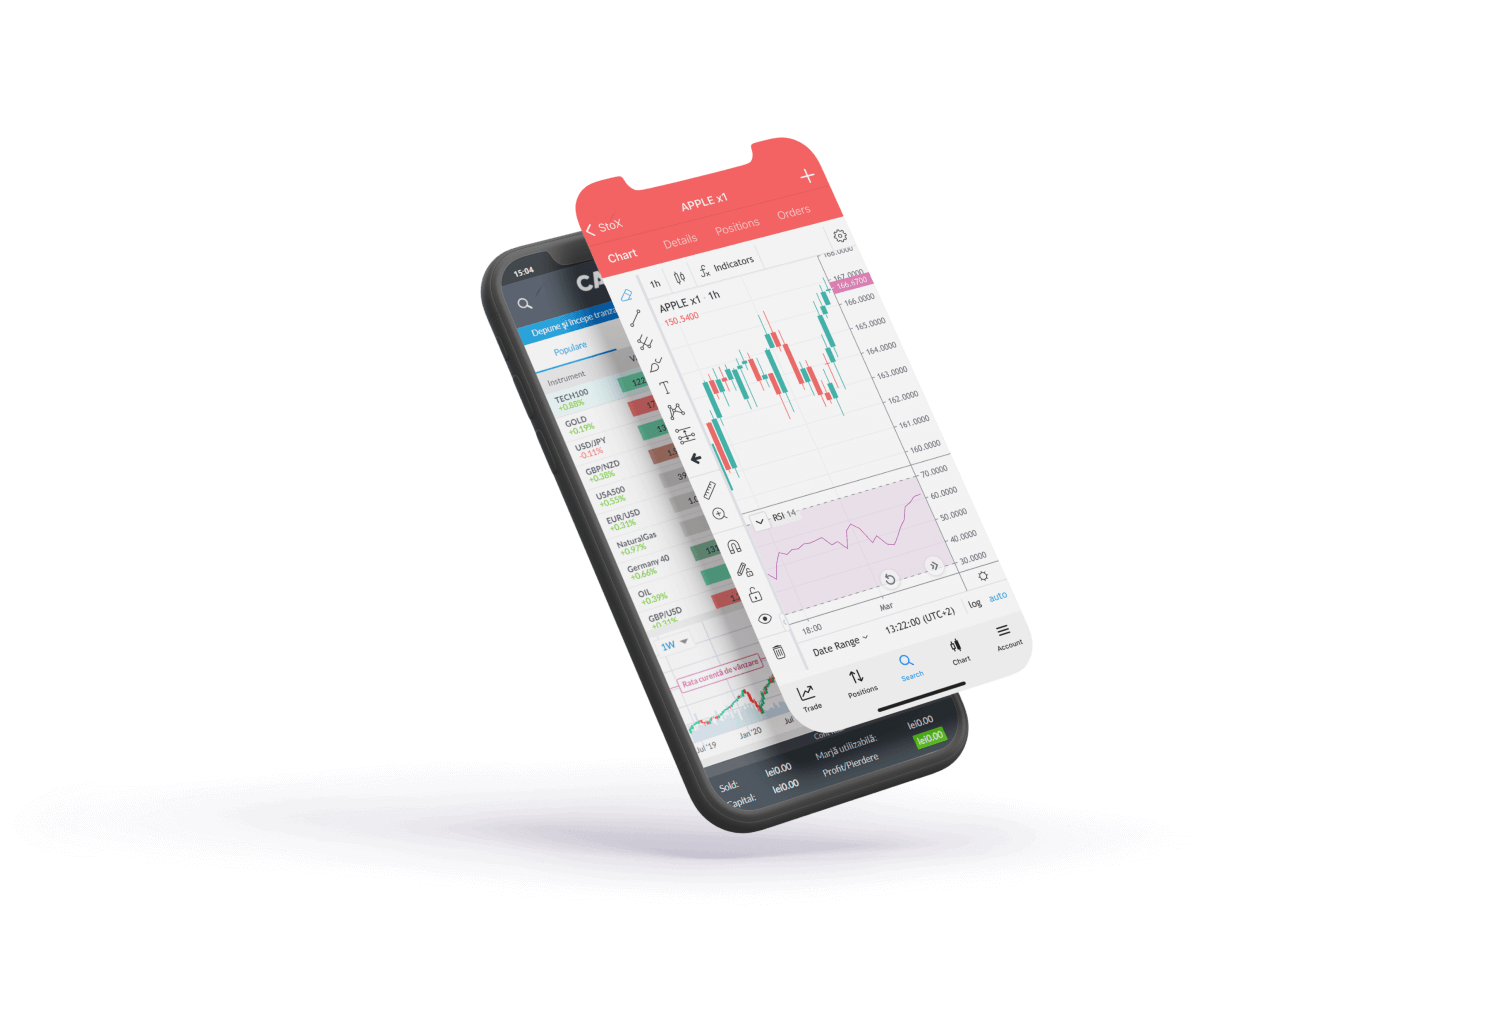
All-In-One
Options create
opportunities
Instant access to over 2100 leveraged products on FX,
indices, commodities, bonds, and more.
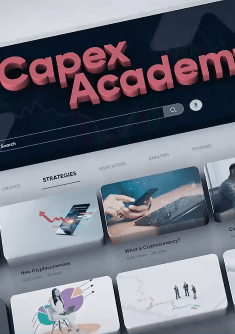
Capex
Academy
Tutorials, Analysis,
Charting, and Trends
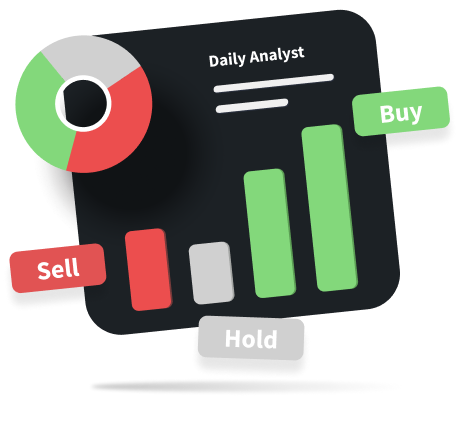
Easy to use, packed with features. Analysis tools
from Trading Central, Insiders' Hot Stocks, Bloggers Opinions,
Daily Analyst Ratings, Hedge Funds Activity, and News
Sentiment from TipRanks.


- Instrument
- Buy
- Sell
- 30D Trend
On the move
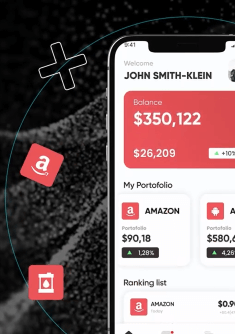
Fast and reliable trading, always connected, on our full-featured mobile app for phones or tablets, iOS and Android.
4.6
App rating


4.6
App rating


Why traders
choose
CAPEX.com

Security
Segregated bank accounts keep your money safe & separated from ours