- Markets
- Resources
- Company

")
Welcome to the New Era of AI-Driven Trading!
CAPEX and Devexa are shaping a new era of trading powered by artificial intelligence, where decisions are clearer, insights faster, and opportunities easier to act on.

Learn the Markets with a Trusted Expert
Access daily insights and educational content from Andreas Thalassinos, one of the industry’s most experienced market experts.
Your First Trades Are on Us, Risk-Free!!
Explore 5,000+ opportunities across commodities, forex, and stocks, with protection on your first trades.
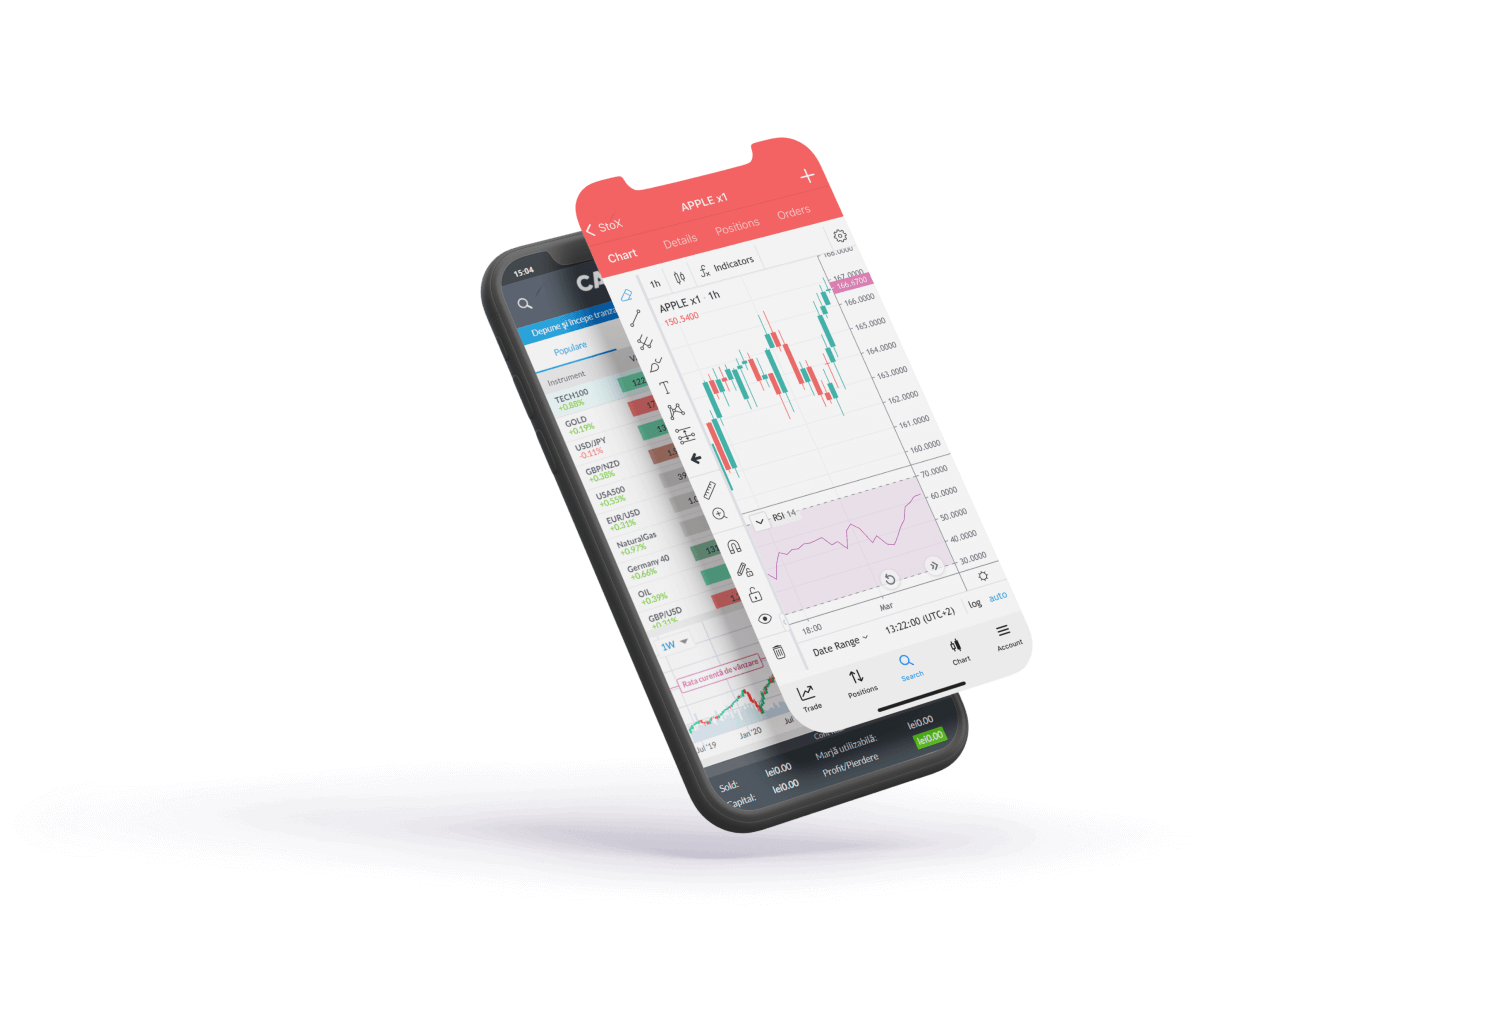
All-In-One
Options create
opportunities
Instant access to over 2100 leveraged products on FX,
indices, commodities, bonds, and more.
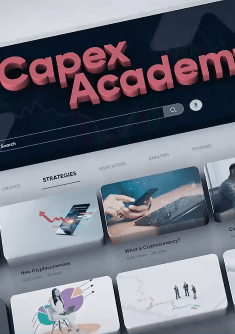
Capex
Academy
Tutorials, Analysis,
Charting, and Trends
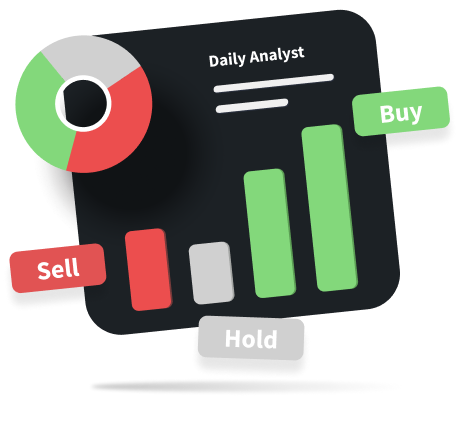
Easy to use, packed with features. Analysis tools
from Trading Central, Insiders' Hot Stocks, Bloggers Opinions,
Daily Analyst Ratings, Hedge Funds Activity, and News
Sentiment from TipRanks.


Trusted Reviews From
Leading Industry Platforms
See what top financial websites and real traders say about their experience with our platform.
Trusted Reviews From
Leading Industry Platforms
See what top financial websites and real traders say about their experience with our platform.


Capex.com appeals to a wide spectrum of traders, from beginners starting with a $100 minimum deposit to professionals seeking premium spreads and tailored support


Investing.com

It promises a customer-centered and education-oriented business philosophy backed by powerful technology

DailyForex.com
CAPEX is mostly a broker for professional traders prepared to work with the company long-term.

TradersUnion.com
Capex is a global broker with over 2,100 trading instruments across forex, commodities, indices, cryptocurrencies, ETFs, bonds, blends and shares.

DayTrading.com
CAPEX has the goal of changing how people invest. Its main mission is to offer resources and expertise to investors so they can access an optimal trading environment.

TopRatedForexBrokers.com
The Scam Detector website Validator gives capex.com one of the higher trust scores on the platform: 88.3. It signals that the business is best defined by the following tags: Authentic. Trustworthy. Secure.

Scam-Detector.com
Regulated broker with competitive trading conditions

Rankia
Easy and fast highly recommending it

Hibbaan Saqa
Fast reliable app with full trading features

Bahoo Ahmed
- Instrument
- Buy
- Sell
- 30D Trend
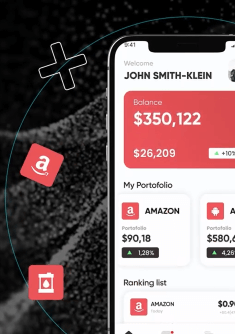
On the move
Fast and reliable trading, always connected, on our full-featured mobile app for phones or tablets, iOS and Android.
4.6
App rating


4.6
App rating


Why traders
choose
CAPEX.com

Security
Segregated bank accounts keep your money safe & separated from ours